Ready
Getting Started with Magistrala UI
Magistrala has for the past decade been built to be an industrial grade, robust, scalable, and fully open-source IoT platform. With comprehensive APIs, CLI tools, and deep extensibility, it was built developer first, offering everything needed to build complex IoT solutions.
But not every user wants to live in the terminal. To make Magistrala more accessible for low-code users, system operators, and teams that prefer visual workflows, we built Magistrala UI — a powerful graphical interface that brings the full capabilities of the Magistrala platform into an intuitive, browser-based experience.
Through the UI, you can manage users, clients (devices and applications), group clients, organize domains (workspaces), configure real-time rules, monitor alarms, build dashboards, and visualize message data — all without writing code. It gets better, for those who want to explore quickly, we offer a free trial for our cloud, giving you a hands-on way to experience the platform in action. For open-source users running Magistrala on their own infrastructure, the UI is also available as a self-hosted deployment.
In this guide, we’ll walk through how the Magistrala UI is structured, what each major section enables, and how it all fits together to help you manage your IoT systems more efficiently.
How the Platform is Organized
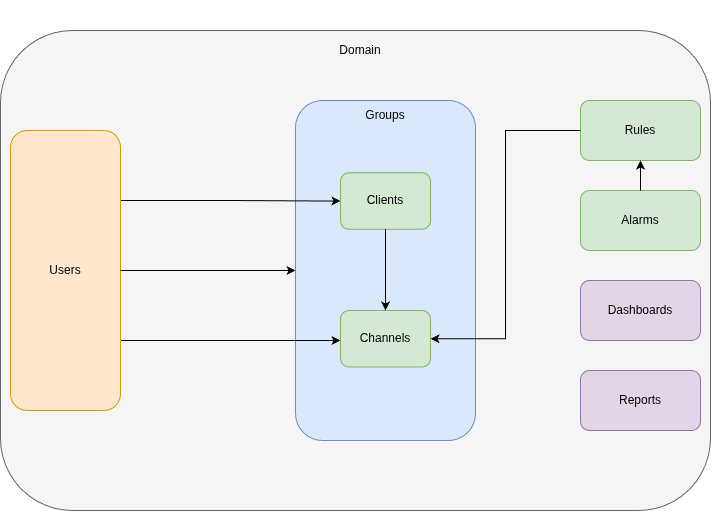
Before diving into specific features, it helps to understand how Magistrala UI structures your IoT infrastructure.
At the top level, you have domains — isolated workspaces where your IoT projects live. Think of them as separate environments: one for production, another for testing, or different domains for different customers if you’re running a multi-tenant setup.
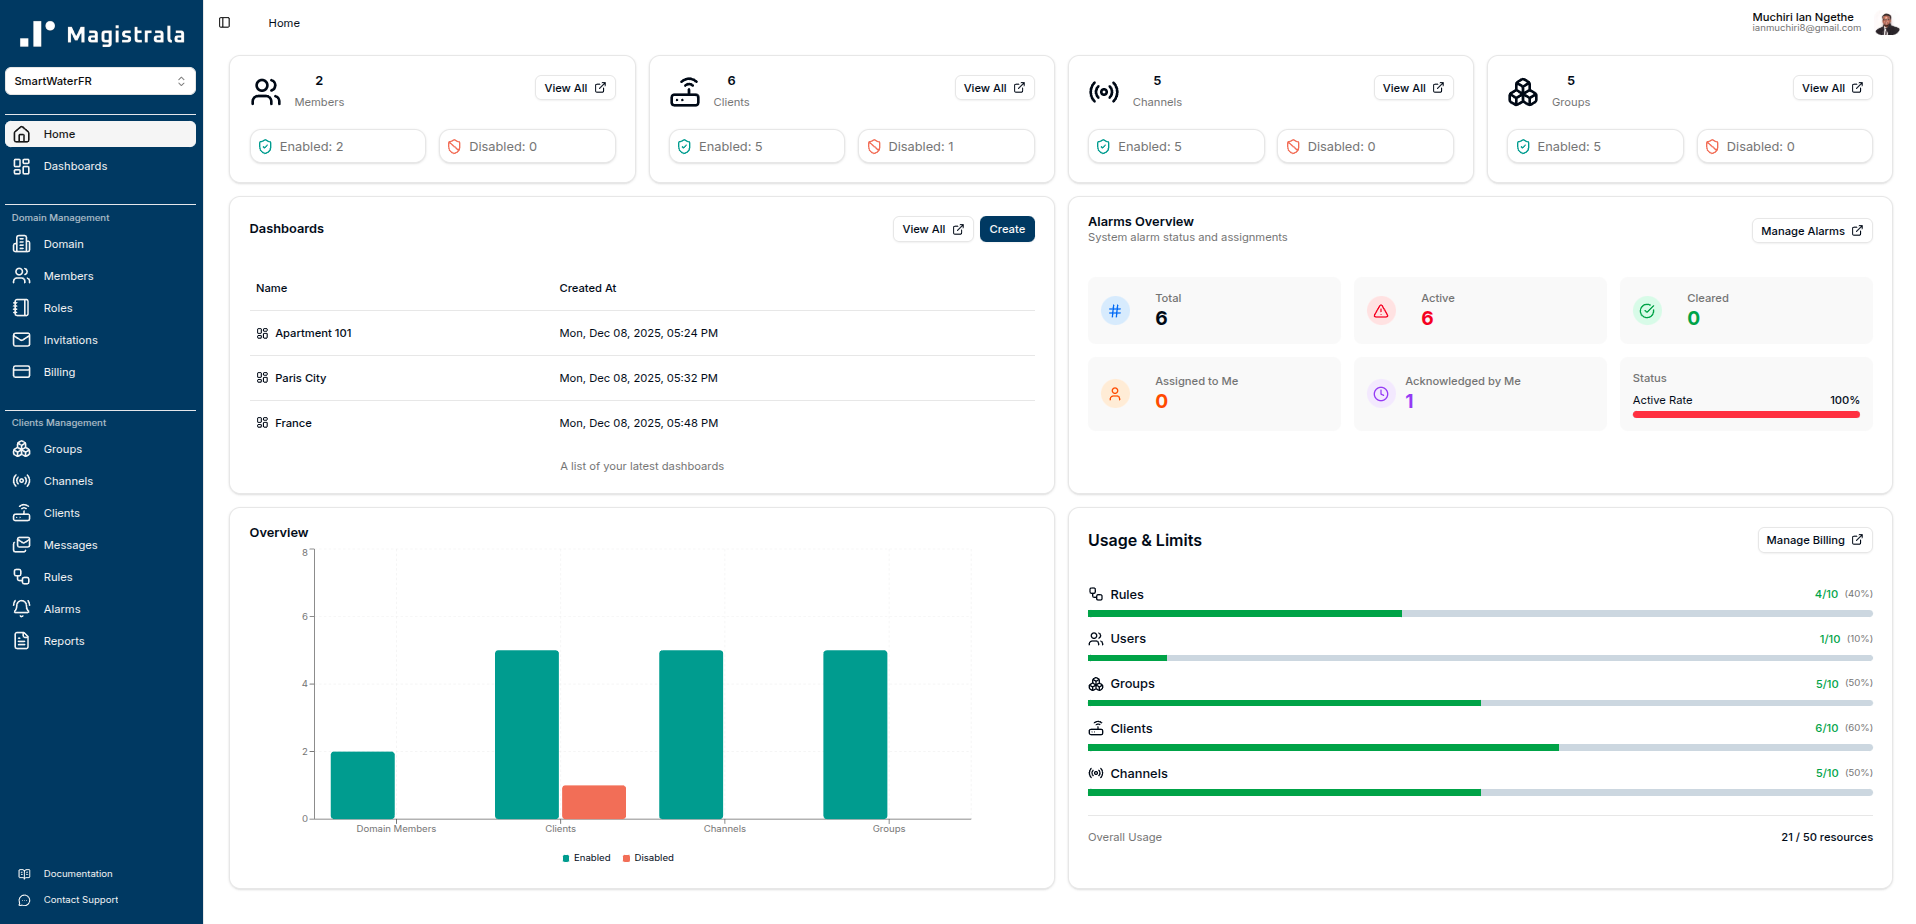
Inside each domain, you manage clients (your devices and applications), groups (logical collections of clients), channels (communication pathways), and users (team members with specific roles and permissions). Clients can be organized into groups for easier management at scale. Clients connect to channels to send and receive messages. Those messages can trigger rules that automate actions, raise alarms when thresholds are breached, and feed into dashboards for visualization.
This structure gives you logical isolation, role-based access control, and a clear mental model: domains contain everything, groups organize clients, clients talk through channels, rules process data in real-time, and dashboards make sense of it all.
Profile Management
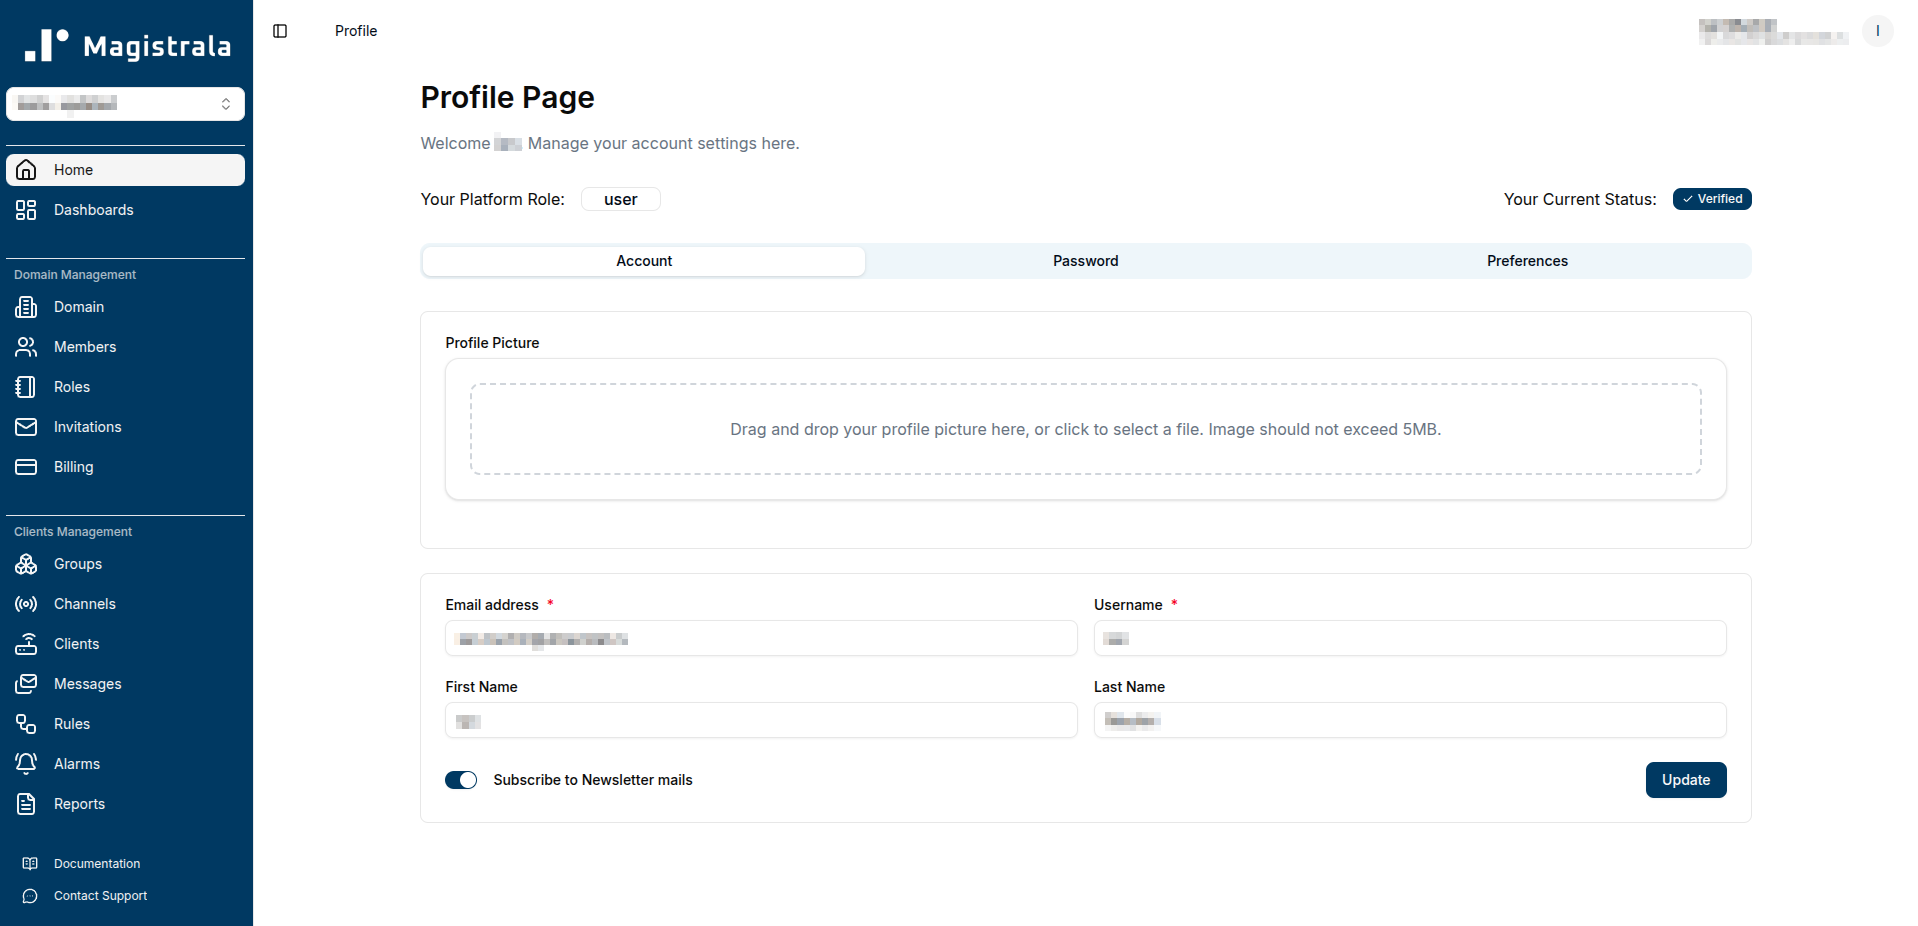
What it is: Your personal account settings — the starting point for using Magistrala UI.
Why it matters: Before you can manage devices or build dashboards, you need an account. Profile management lets you control your identity, credentials, and preferences across the platform.
What you can do:
- Sign up and create your account
- Update your name, email, and password
- Set your preferred theme (light or dark mode)
- Choose your language preference
It’s straightforward, but it’s also where you establish your access to everything else in the platform.
Learn more: User Quick Start Guide
Domain Management
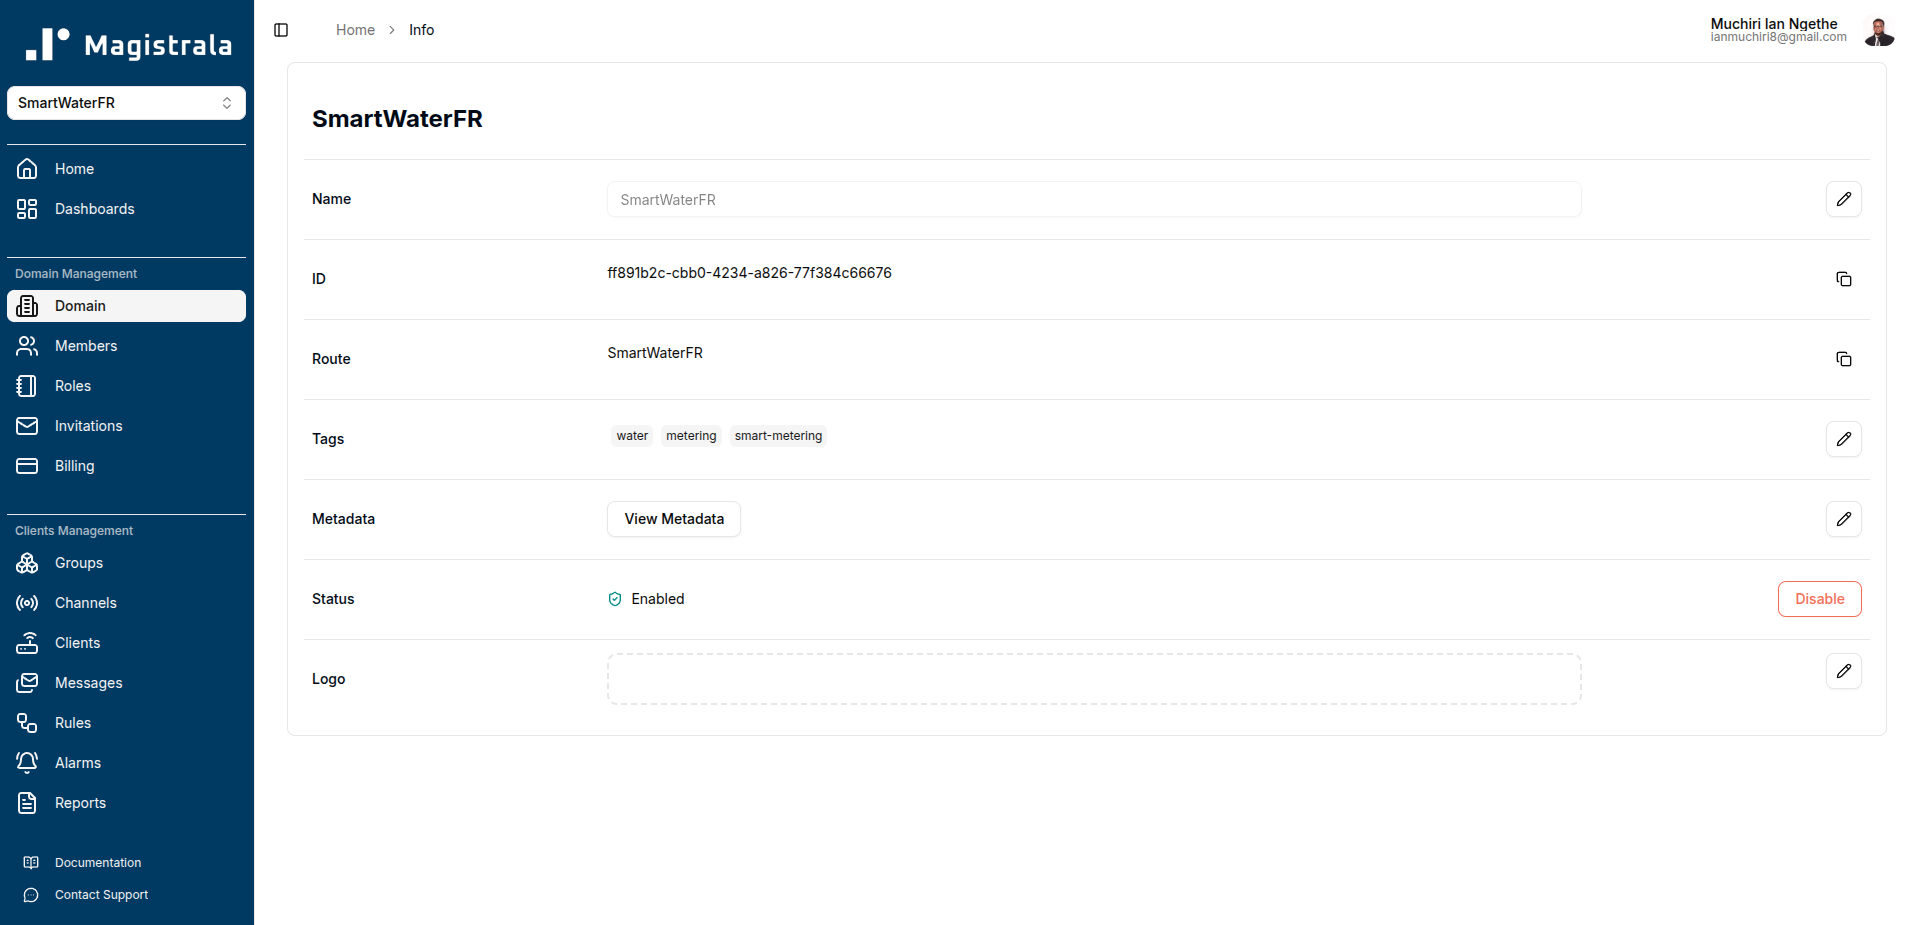
What it is: Domains are logical workspaces that provide multi-tenancy and isolation within Magistrala.
Why it matters: If you’re managing multiple projects, customers, or environments, you need separation. Domains let you partition your infrastructure so that production doesn’t mix with staging, or Customer A’s data stays isolated from Customer B’s.
What you can do:
- Create and configure domains
- Enable or disable domains as needed
- Update domain details and metadata
- Invite team members and assign roles
- Control who has access to what within each domain
Domains are the foundation of organized, scalable IoT deployments. They give you control over access, visibility, and operational boundaries.
Learn more: Domain Management Documentation
Client Management
What it is: Clients are the entities that interact with your IoT platform — split into devices (sensors, actuators, edge hardware) and applications (backend services, mobile apps, integrations).
Why it matters: Your clients are the core of your IoT system. Managing them efficiently means you can provision at scale, organize by function or location, and control credentials without manual overhead.
What you can do:
- Create and provision devices and applications
- Generate and manage authentication credentials
- Assign roles and permissions to users over specific clients
- Connect clients to channels for messaging
- Bulk import and export client configurations
- Organize clients into groups (see Groups section below)
The distinction between devices and applications matters: devices typically generate data, while applications consume or process it. The UI lets you manage both in one place.
Learn more: Client Management Guide
Groups
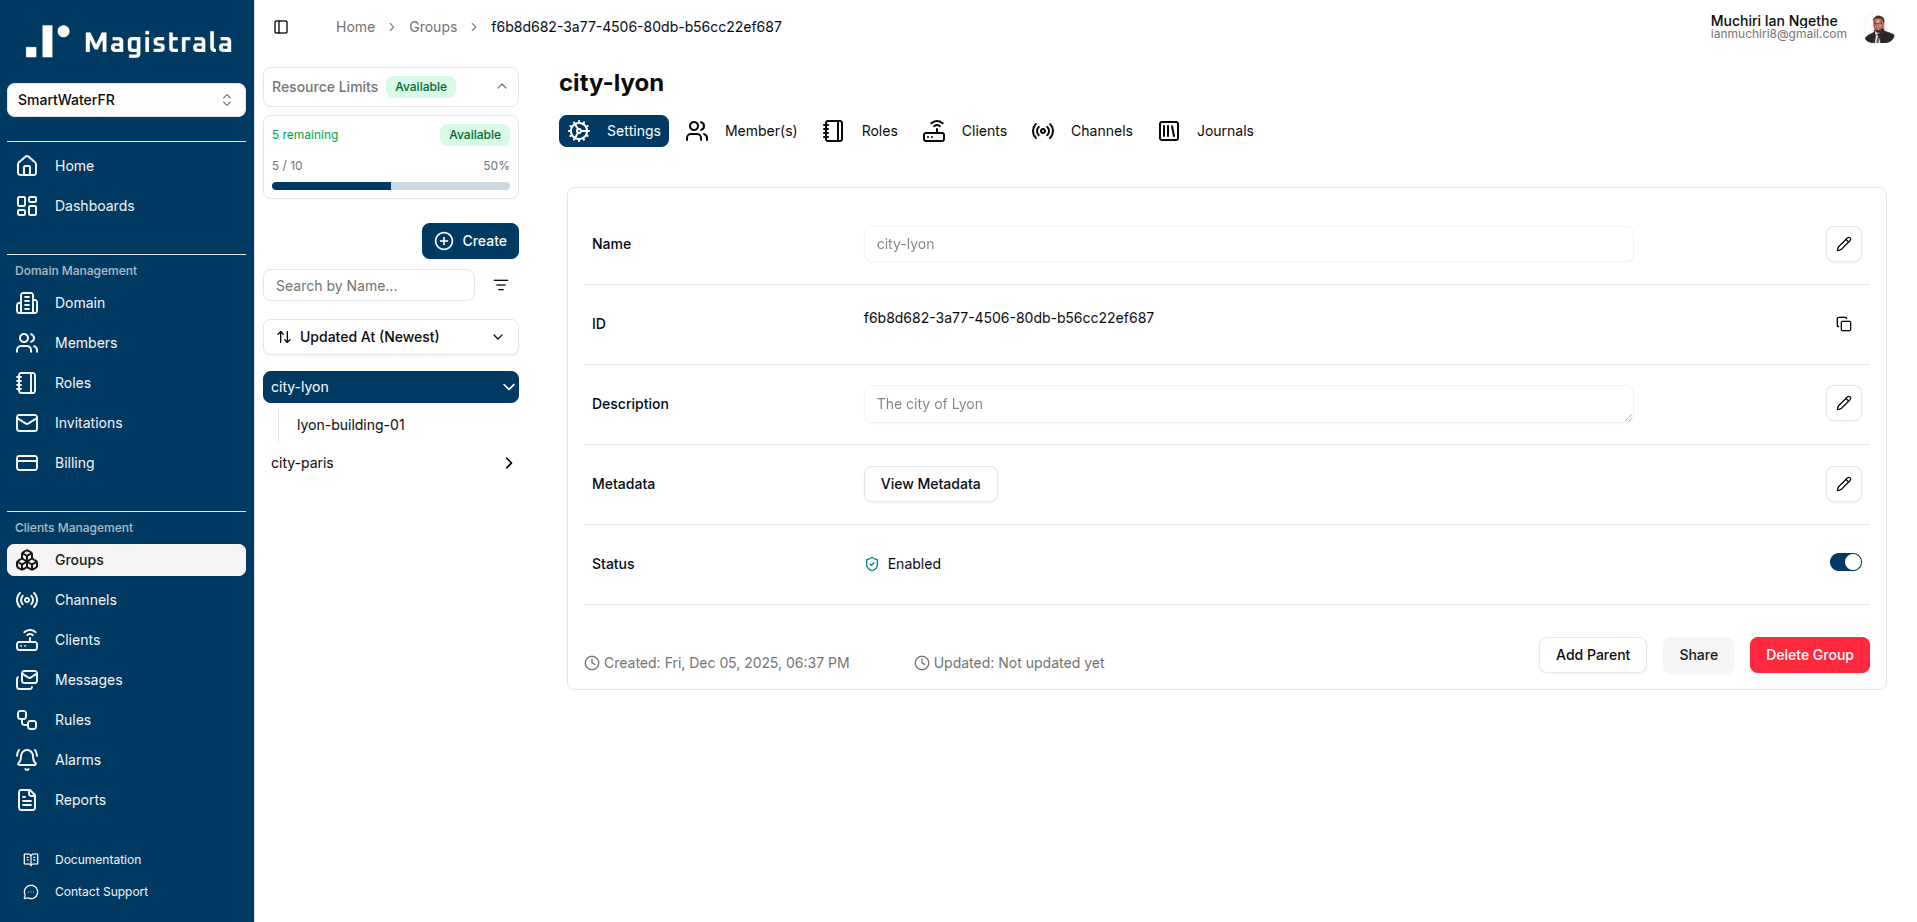
What it is: Groups are logical collections that let you organize both clients (devices and applications) and channels into hierarchical structures.
Why it matters: As your IoT deployment grows, managing hundreds or thousands of individual clients and channels becomes unwieldy. Groups solve this by letting you organize them by location, function, customer, or any other criteria that makes sense for your use case. More importantly, groups can contain other groups, enabling you to build hierarchical organizational structures that mirror your real-world infrastructure.
What you can do:
- Create groups to organize clients and channels logically (e.g., “Building A Sensors”, “Fleet Vehicles”, “Production Line 3”)
- Build hierarchical structures by nesting groups within groups (e.g., “North America” → “California” → “San Francisco Office” → “Floor 2 Sensors”)
- Add or remove clients and channels from groups dynamically
- Assign permissions and roles at the group level instead of per-client or per-channel
- Filter alarms and rules by group membership
- Bulk manage clients and channels within a group
Real-world examples:
- Geographic hierarchy: Organize devices and their communication channels by Region → City → Building → Floor
- Functional grouping: Separate temperature sensors, motion detectors, and actuators along with their respective channels into distinct groups
- Customer segmentation: In multi-tenant scenarios, create top-level groups for each customer with sub-groups for their sites, containing both their devices and channels
- Deployment stages: Group devices and channels by production, staging, and development environments
Groups are essential for scaling your IoT operations. They transform client management from a flat list into an organized, navigable structure that matches how you think about your infrastructure.
Learn more: Groups Documentation
Channels and Messaging
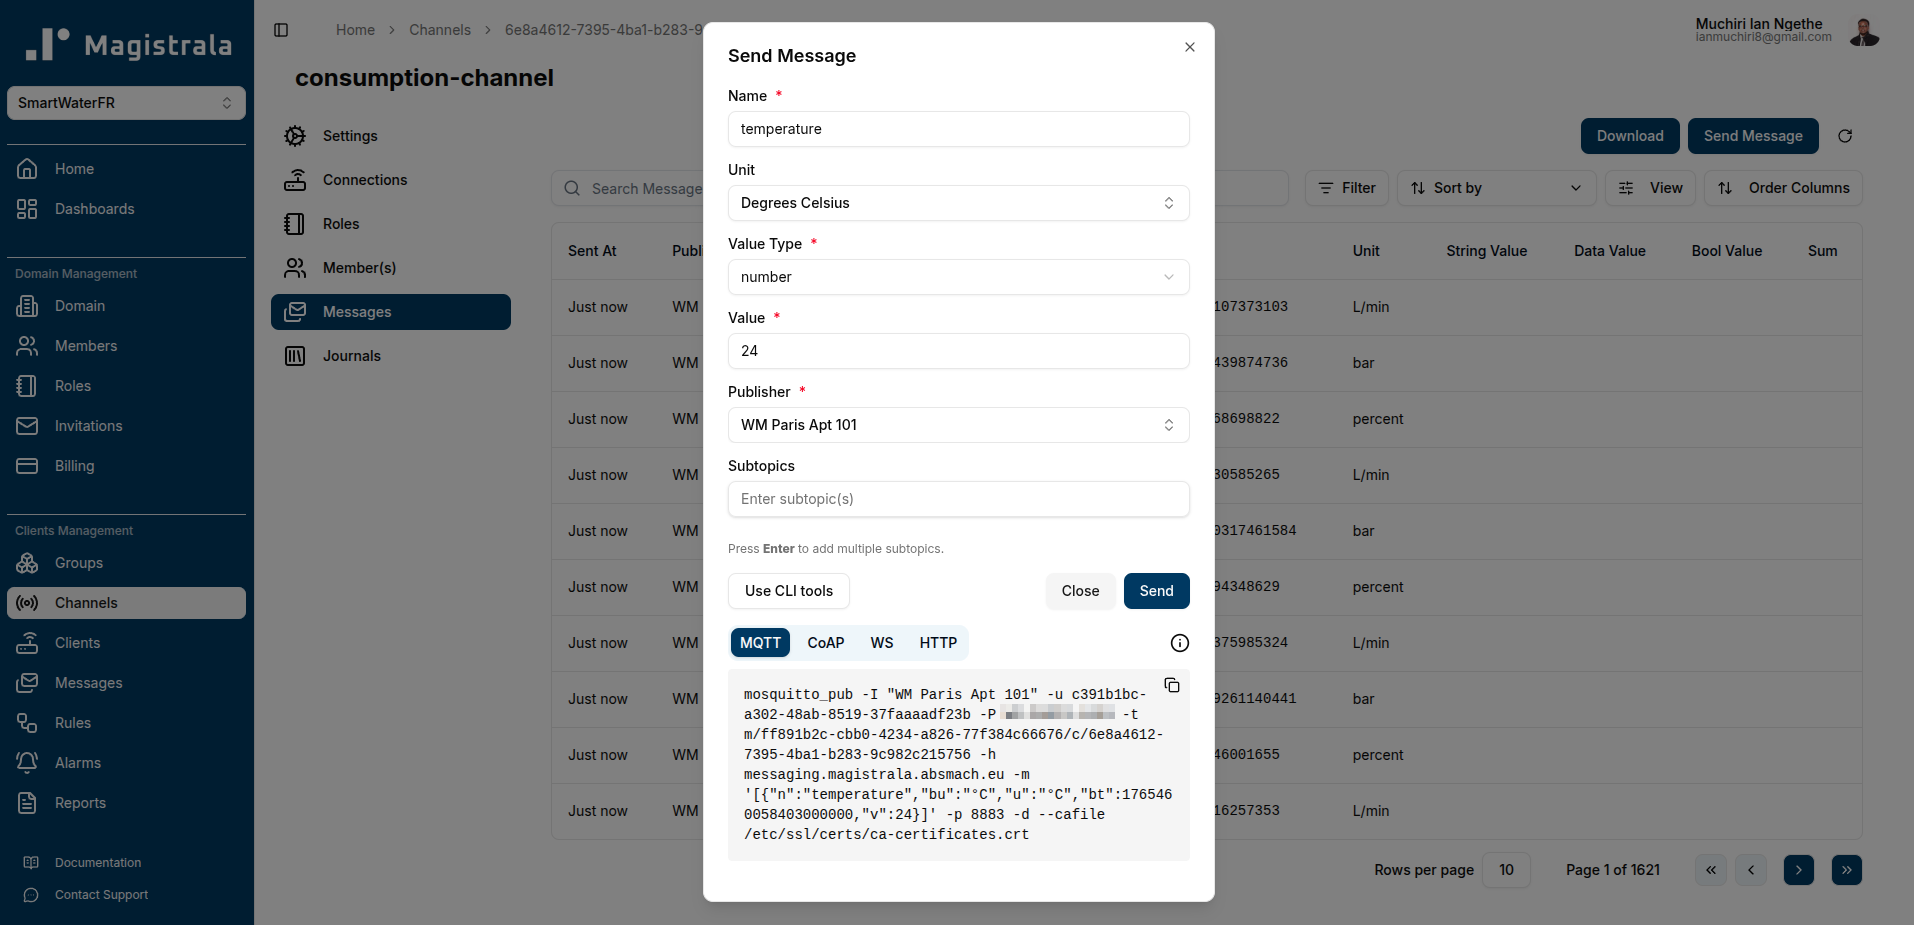
What it is: Channels are communication pathways. Clients connect to channels with publish, subscribe, or both permissions to send and receive messages.
Why it matters: Channels define how data flows through your system. They’re the pipes that connect sensors to applications, devices to dashboards, and edge nodes to cloud services.
What you can do:
- Create channels and configure access policies
- Connect clients to channels with granular permissions (publish, subscribe, or both)
- Exchange messages using multiple protocols, including HTTP, MQTT, WebSocket, and CoAP.
- Save messages to internal storage using rules
- Monitor message flow in real-time
Channels give you flexibility: you can have a single device publish to multiple channels, or multiple devices publish to one channel that feeds a dashboard. The UI makes these connections visual and manageable.
Learn more: Channels and Messaging Documentation
Rules Engine
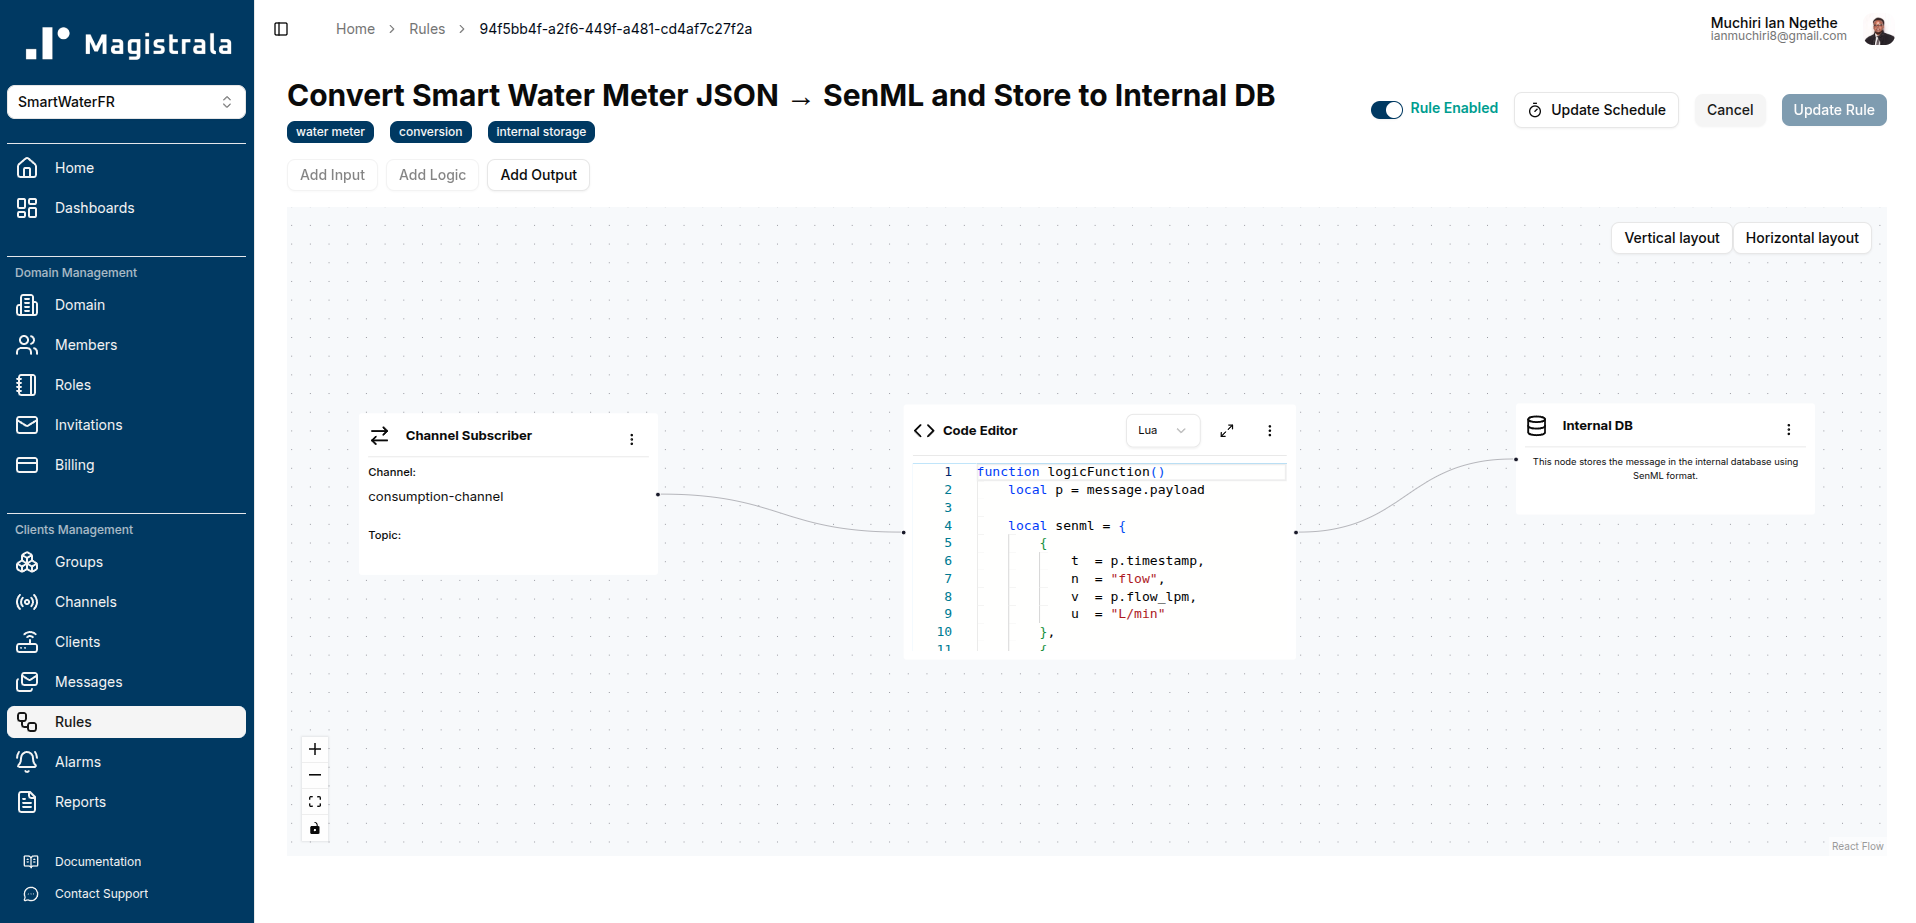
What it is: A visual rule management system that lets you define real-time logic without writing backend code.
Why it matters: IoT systems generate continuous streams of data. Rules let you act on that data as it arrives — filtering, transforming, routing, and triggering actions based on conditions you define.
What you can do:
- Create rules using a visual interface
- Save messages to the internal database
- Publish processed messages to other channels
- Store data in external PostgreSQL databases
- Send email notifications
- Post alerts to Slack
- Generate alarms based on thresholds or patterns
Rules are powered by Lua or Go under the hood, while the UI helps you configure logic, triggers, and actions without needing to manage the execution layer directly. You define conditions, actions, and outputs — the platform handles execution.
This is where automation happens. A temperature sensor crosses a threshold? Trigger an alarm and send an email. A device goes offline? Log it and notify your ops team.
Learn more: Rules Engine Guide
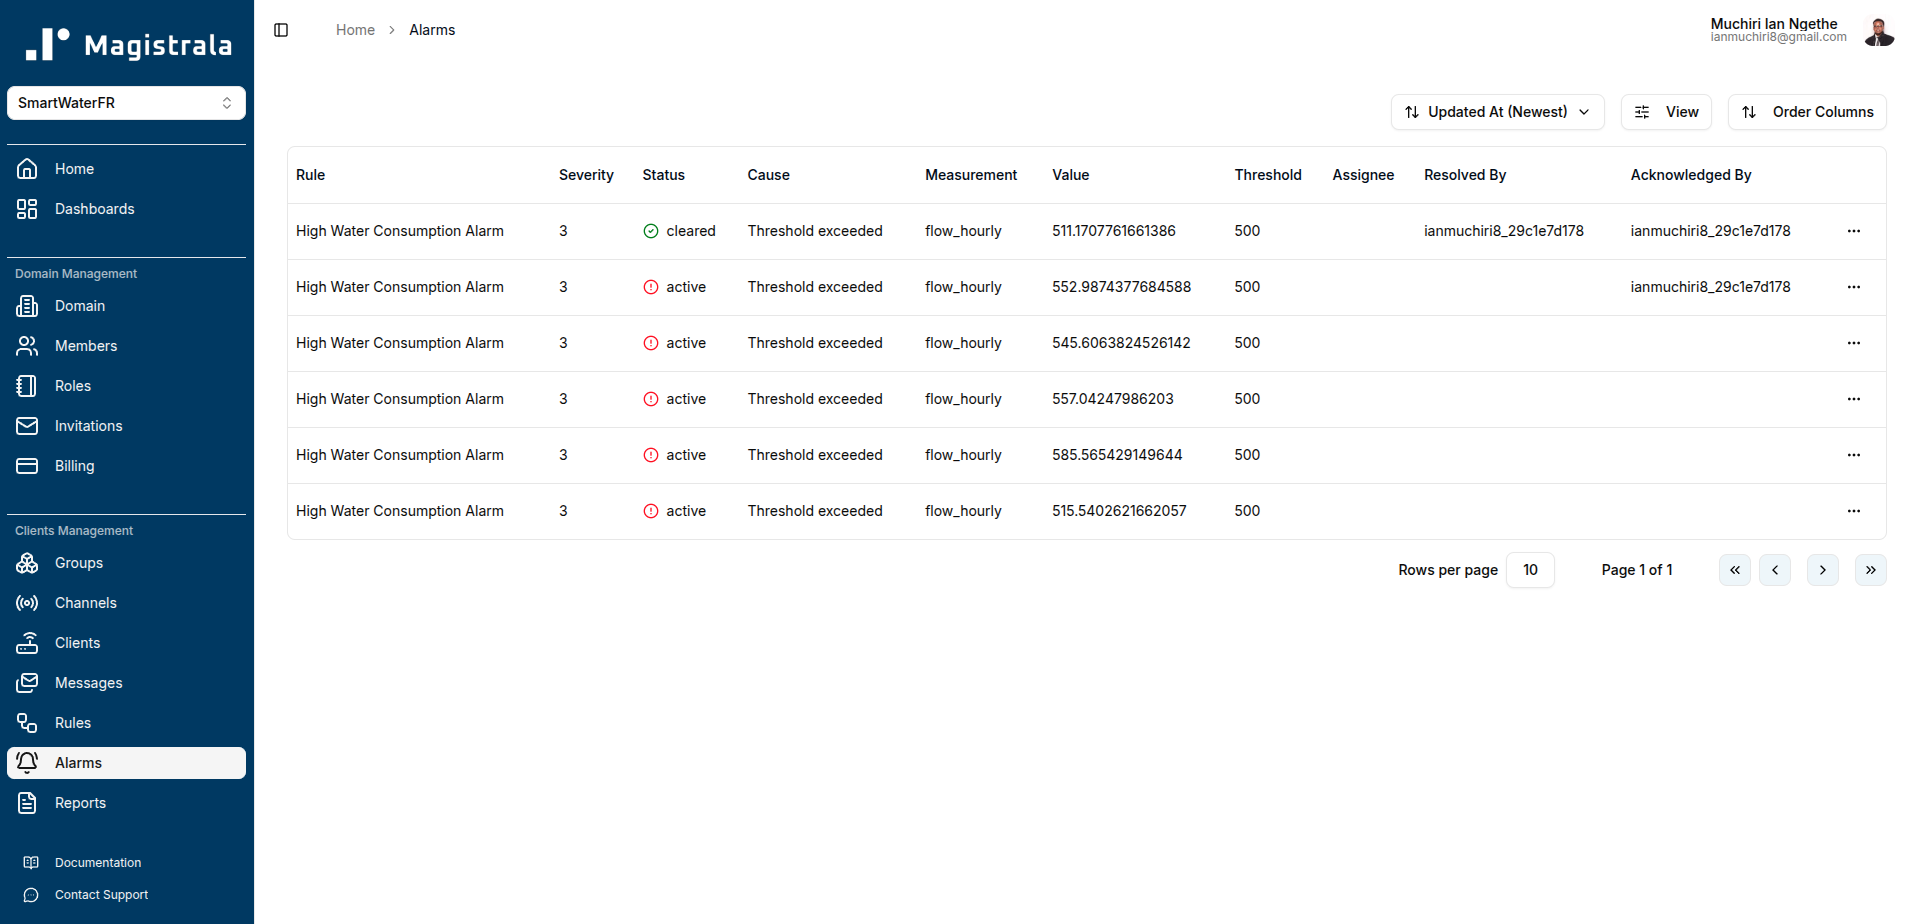
Alarm Management
What it is: A system for monitoring conditions, triggering alerts, and managing alarm lifecycles.
Why it matters: In production IoT systems, you need to know when something goes wrong — and you need to track how your team responds.
What you can do:
- Define alarm conditions through the rules engine
- Monitor active alarms in real-time
- Acknowledge alarms to signal you’re aware
- Assign alarms to team members for resolution
- Clear alarms once issues are resolved
- Delete alarms when no longer relevant
- View alarm history and audit trails
Alarms bridge the gap between data and action. They turn abstract metrics into concrete alerts that demand attention.
Learn more: Alarm Management Documentation
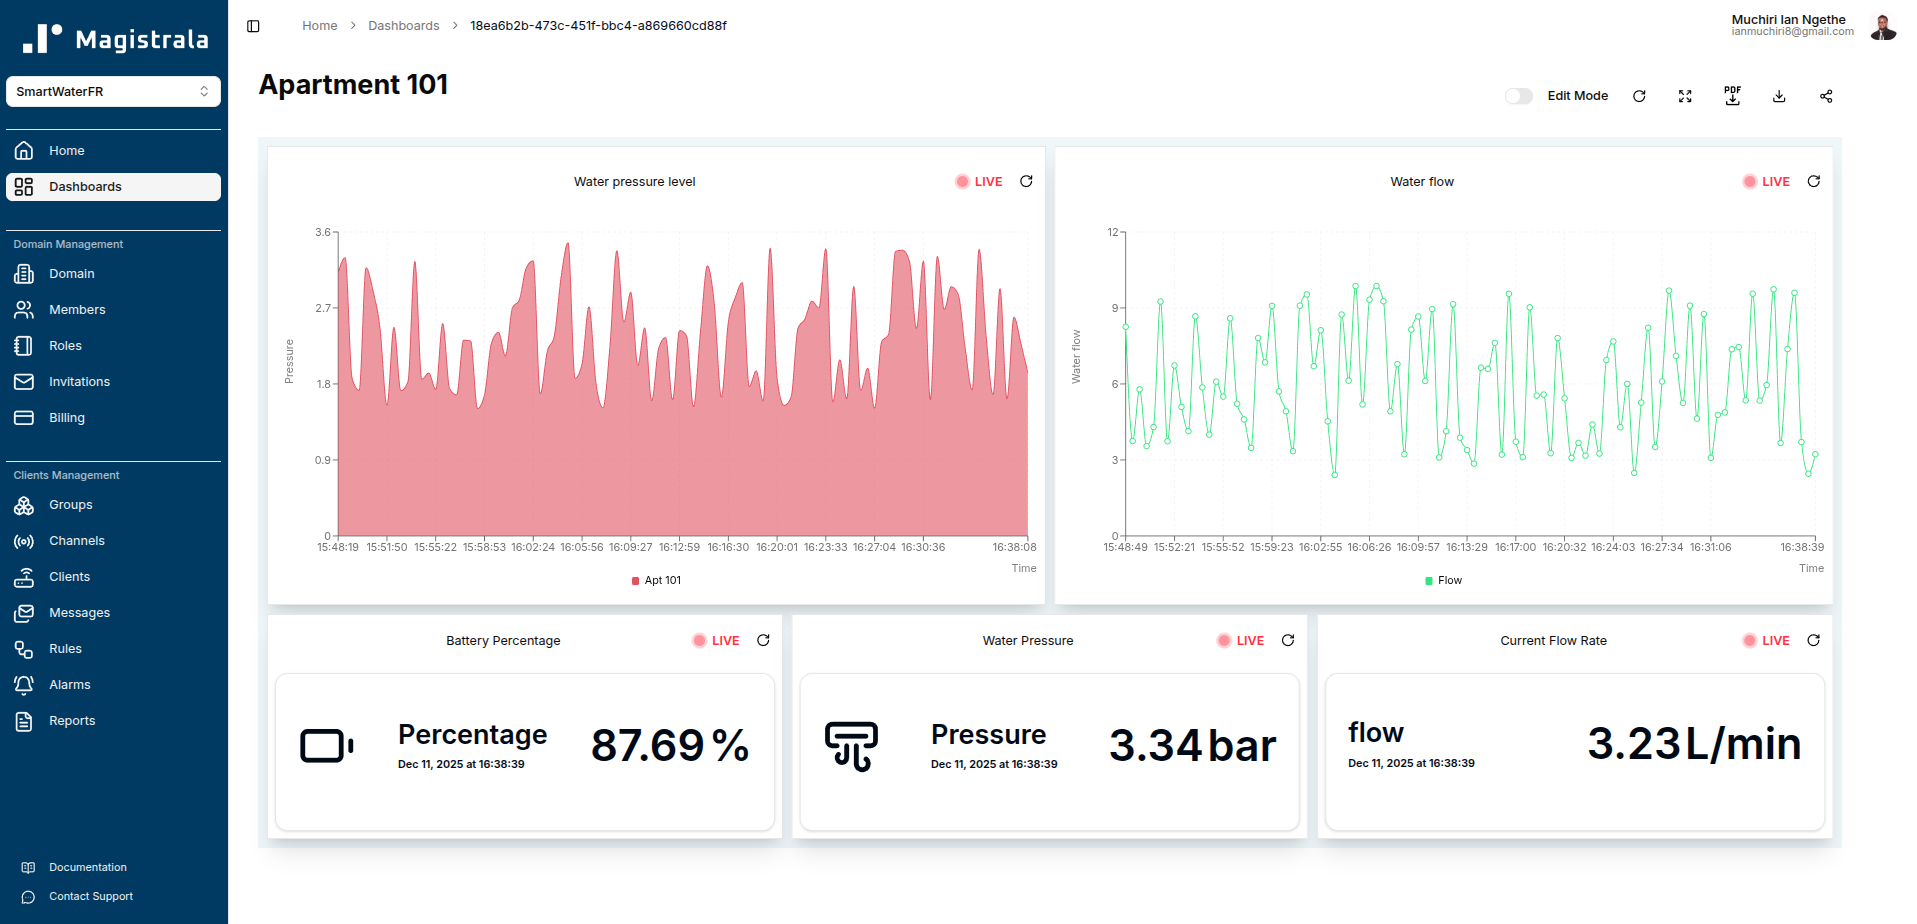
Dashboards and Visualization
What it is: A dashboard builder that turns raw message data into charts, graphs, and real-time insights.
Why it matters: Data is only useful if you can understand it. Dashboards let you visualize trends, monitor live metrics, and share insights with stakeholders who don’t need API access.
What you can do:
- Build custom dashboards with drag-and-drop widgets
- Display live charts with near-real-time updates
- Query historical data and apply aggregations (min, max, avg, sum)
- Monitor alarms directly from dashboards
- Visualize entity metadata and status
- Share dashboards publicly (no login required)
Dashboards are where technical data becomes business intelligence. You can track fleet health, monitor environmental conditions, or display KPIs for operations teams.
Learn more: Dashboards Documentation
Reports
What it is: A reporting system that lets you generate, schedule, and distribute data summaries.
Why it matters: Not everyone needs a live dashboard. Sometimes you need a PDF report emailed weekly, or a CSV export for compliance audits.
What you can do:
- Create instant reports on demand
- Schedule recurring reports (daily, weekly, monthly)
- Upload custom report templates
- Email reports automatically to stakeholders
- Download reports in multiple formats
Reports are built for operational workflows: end-of-shift summaries, compliance documentation, or executive briefings. They’re the structured output layer on top of your real-time data.
Learn more: Reports Guide
Cloud vs Self-Hosted UI
Magistrala UI is available in two deployment models, depending on your needs.
Magistrala Cloud
Managed by our team, hosted infrastructure, zero setup. You sign up, and you’re running within minutes.
- Quick start: No installation, no configuration
- Free trial: Explore the platform before committing
- Enterprise options: Dedicated support, SLAs, and custom deployments
Best for teams that want to focus on building IoT solutions, not managing infrastructure.
Get started: Magistrala Cloud
Self-Hosted UI
Run the UI on your own infrastructure using Docker. Full control, full ownership.
- Complete control: You manage the stack, the data, and the deployment
- Works with open-source Magistrala: Integrates seamlessly with your self-hosted Magistrala backend
- On-premises or private cloud: Deploy wherever your security or compliance requirements demand
The Magistrala platform itself is open source, while the UI is distributed as a packaged service component for self-hosted deployments.
Best for teams with strict data residency requirements, or those already running Magistrala on-premises.
Learn more: Self-Hosted Deployment Guide
Who is Magistrala UI For?
Magistrala UI is built for teams that need production-grade IoT infrastructure without the overhead of building everything from scratch.
It’s for IoT platform engineers who want visual tools alongside APIs. For operations teams who need dashboards and alarms, not terminal commands. For system integrators managing multi-tenant deployments. For CTOs evaluating scalable, open-source alternatives to proprietary platforms.
If you’re building connected systems — whether it’s industrial monitoring, smart infrastructure, fleet management, or environmental sensing — Magistrala UI gives you the tools to manage it all without writing backend code for every workflow.
Conclusion
Magistrala UI brings the full power of the Magistrala IoT platform into a visual, accessible interface. From provisioning devices to building dashboards, from defining real-time rules to managing alarms, it’s designed to make complex IoT operations manageable.
Whether you’re running a proof-of-concept on Magistrala Cloud or deploying a self-hosted production system, the UI scales with you.
Ready to explore? Start your free trial or dive into the docs.